Data tables from a matrix
Some data is already a table: three months of payslip figures, a stock count, a report your system exports. Point Papers at it and it builds the table for you, rows and columns and all, instead of you drawing one and repeating a row inside it.
When to use this instead of a repeating table
A repeating section is right when you know the columns and the data is a list of things with named fields: an invoice line has a description, a quantity and a price, every time.
This is right when you do not know the shape, or the shape changes: whatever your data has, in whatever order, becomes the table. Nobody has to edit the template when a column is added.
Shape the data as rows of rows
The field you point at has to hold a list of lists. Each inner list is one row, and each item in it is one cell:
{
  "lastThreeMonths": [
    ["Month", "Gross", "Deductions", "Net"],
    ["May 2026", "28 200,00", "5 412,00", "22 788,00"],
    ["June 2026", "28 200,00", "5 412,00", "22 788,00"],
    ["July 2026", "28 200,00", "5 412,00", "22 788,00"]
  ]
}
That is the difference from a repeating section, which walks a list of objects. Here the first row is usually your column headings, carried in the data rather than typed into the template.
Rows do not have to be the same length. A short row is padded out so the table stays square.
Insert the table
Put the cursor where the table belongs and choose Insert visualisation from the toolbar. The dialog is headed Data table.
Data source is the field holding the matrix, lastThreeMonths in the example above. Start
typing and it offers the fields in your sample data that hold rows and columns.
Choose Apply. The block that lands in the document is labelled with the source you chose, Data table: lastThreeMonths, and shows the table built from the sample data you have selected. When you produce a document, the table is built again from that document's data.
If the block shows Pick a data source instead, the source does not resolve to rows and columns in your sample data. Check the path against the Sample Data pane.
Click the block's label to reopen the dialog and change any of this. Remove in the dialog takes the table out.
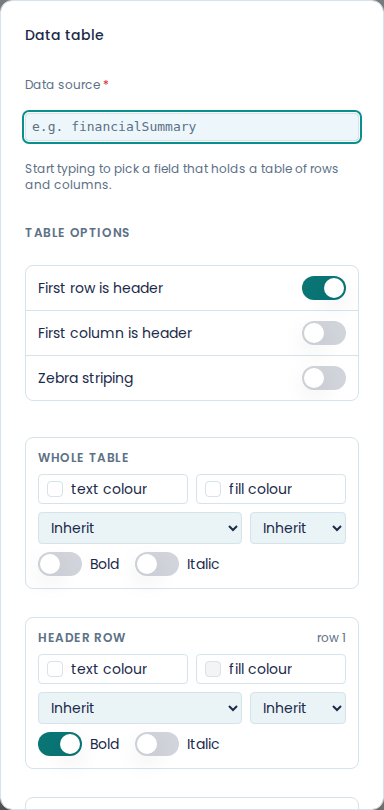
Say which cells are headings
Table options has three switches.
First row is header treats row one as column headings, and is on by default. Turn it off when your data has no heading row.
First column is header does the same down the left, for a table whose rows are labelled.
Zebra striping shades alternate body rows. It earns its place on a table more than about six rows deep and gets in the way on a short one.
Style it by role
The rest of the dialog styles the table by role rather than cell by cell. Whole table sets the defaults. Each switch you turn on under Table options adds a section that overrides them: Header row for the headings, First column for the row labels, and Alternate rows for the striped rows. Each section has text colour, fill colour, font, size, bold and italic.
Set the font on Whole table and only override what genuinely differs. A header row that is only bold is easier to read, and easier to change later, than one carrying five overrides.
Set the borders
Borders takes a mode (None, All, Horizontal, Vertical or Outline), a width of 1pt, 2pt or 3pt, a line style of solid, dashed or dotted, and a colour from the swatch beside them.
Horizontal is the one that looks like a report. All looks like a spreadsheet.
Alignment happens on its own
Papers aligns each column by looking at what is in it: a column that holds mostly numbers goes right, text goes left. You can override a column from Column alignment when it guesses wrong, which is usually a code or a reference number that looks numeric but should read as text. Set the column to Left, Centre or Right, or back to Auto.
Column alignment only appears once the data source resolves to a table in your sample data, because it needs to know how many columns there are.
Check it with test data
Preview the template with sample data that has the matrix in it and count the columns. A source field that does not exist, or holds a list of objects rather than a list of lists, produces nothing at all: no table, no error, no gap. See preview with test data.