Tables
Tables in Papers do two jobs. Most obviously they hold rows of data, like the lines on an invoice. Less obviously they are the way to put two things side by side on a page, which is how you get a logo on the left and an invoice number on the right.
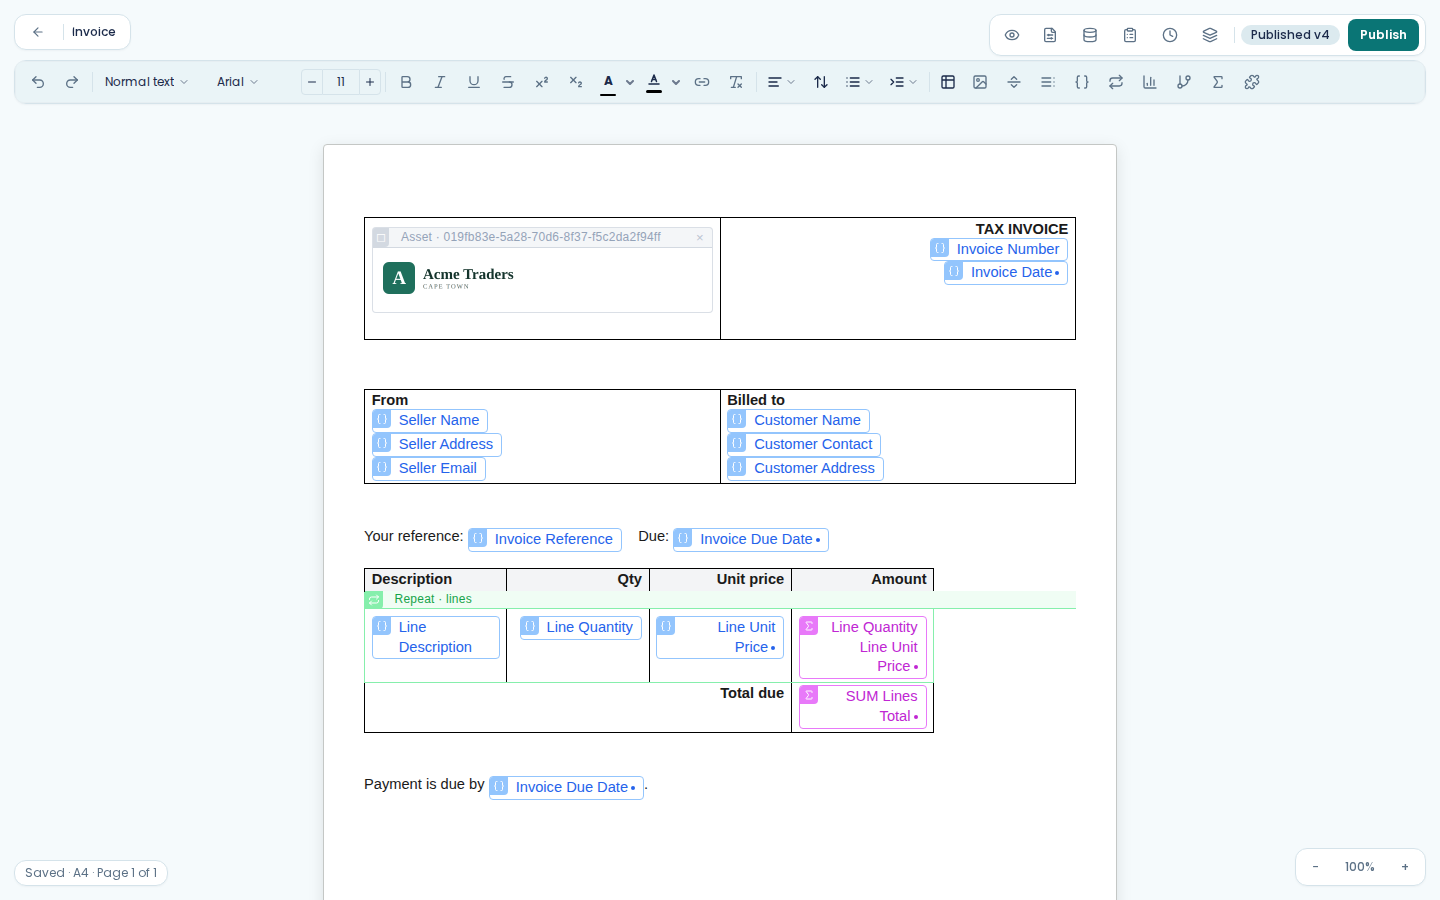
Insert a table
Choose Insert table from the toolbar, move across the grid to pick the number of rows and columns, and click. Start smaller than you think you need; adding a row later is easy.
Add and remove rows and columns
Click into a cell and the table toolbar appears. From there you can add a row above or below, add a column left or right, and delete a row, a column or the whole table. Hover over a button to see its name. Right-clicking a cell gives you the same actions as a menu.
If you cannot get a cursor into a table because every cell is full of variable chips, click on the table's structure rather than its contents. Papers drops the cursor into the nearest cell, which is what makes the controls reachable.
Set a header row
The top row of a table is usually labels rather than data. Click into the table, choose Cell properties (the paintbrush) on the table toolbar, and tick Header row. The top row becomes header cells.
Full width, next to it, stretches the table across the page between the margins.
Column widths
Drag the border between two columns. A small label shows the column's width in pixels while you drag, which helps when you want two tables to line up.
For an exact width, click into the column and type the number in the width box on the table toolbar (Column width (px)), then press Enter. Distribute columns evenly makes every column the same width.
If the columns add up to more than the page is wide, Papers scales them all down in proportion so the table stays on the paper.
Cell borders and shading
Select a cell or a range and choose Cell properties on the table toolbar.
Under Background, Choose colour... sets the fill colour of the selected cells.
Border presets set the borders of the whole table in one go: All borders, Outer only, No borders or Horizontal only.
Border size (Thin, Medium or Thick), Border style (solid, dashed or dotted) and Border colour change the borders of the selected cells, on all four sides at once.
No borders is how you build a layout table. A two-cell table with no borders reads as two columns of content, not as a table.
Align a cell's content
Right-click the cell and choose Align left, Align centre or Align right.
Make a row repeat per item
This is what tables are mostly for. Design one body row, put your cursor in it, and choose Insert repeating section from the toolbar. You can also right-click the row and choose Repeat this row.... See repeating sections for the detail.
The header row does not repeat. Only the row you configured does.
Repeat a cell across a row
To get one column per item rather than one row per item, click into the cell and choose Repeat this cell on the table toolbar. Give it the list the same way as a repeating row. The cell is copied across the row once per item.
Show a row only when the data says so
Click into the row and choose Add row condition on the table toolbar, then set the condition as for a conditional section. When the condition is not met, the whole row is left out.
The row then shows an Only if bar in the editor. Click the bar to change the condition or remove it.
Show a cell's content only when the data says so
Click into the cell and choose Add cell condition on the table toolbar. The cell itself always stays, so the columns do not shift; only its content comes and goes. Once a cell has a condition the button reads Edit cell condition.
Right-click a cell and choose Condition this cell's content... for the same thing from the menu.
Repeating rows and cells, and row and cell conditions, are only offered in the body of the document, not in a header or footer.
Total a column
Put a total in a row below the repeating one, using Insert formula rather than a variable:
SUM(lines[].total)
lines is the path to your list and total is the field on each item. The [] means every item in
the list.
AVG, COUNT, MIN and MAX work the same way. So does arithmetic on a single item, which is how
you get a line total inside the repeating row itself:
line.quantity * line.unitPrice
Set Format to Currency on the formula so the result comes out as money.
One thing to know about the sums: they take a single field after the [], so
SUM(lines[].quantity * lines[].unitPrice) will not work. Carry a total on each line in your data
and sum that, and compute the per-line amount in the row where you can see one line at a time.
Merge cells
Select the cells and choose Merge cells on the table toolbar or the right-click menu. A merged cell is how you get a total label spanning the first three columns of an invoice with the amount alone in the fourth. Split cell undoes it.
Put a table inside a cell
This works, and it is occasionally the cleanest way to lay out a document. Do not reach for it first: a nested table is harder to edit and harder for somebody else to understand.
When a table is the wrong tool
If your data holds a grid of values already (rows of rows rather than a list of records) use Insert visualisation instead. It builds the table from the data, so you do not design any of it. Use a normal table when you are designing the columns yourself.